Are Australian charities rich or poor?
insight & foresight is interested in how Australian charities are managing their wealth and to what extent increasing size and sophistication is resulting in balance sheet growth. Charities are always asking for increased levels of funding to deliver services and it seemed timely to take the opportunity to check on the balance sheet health of Australian charities to get an indication as to whether or not increased funding was being used to deliver more services and/or build balance sheets.
Australia is fortunate to have The Australian Charity and Not-for-profit Commission (ACNC) as the national regulator of charities. It manages the registration, reporting and compliance of a sector containing over 59,807 entities. You can read more at www.acnc.gov.au
One of the benefits of the ACNC is the transparency of data that it collects and the opportunities for all Australians to use the data to review and explore how the sector is performing. More analysis of the type conducted in this project should be encouraged.
View the analysis using the slideshow below.


What did we learn?
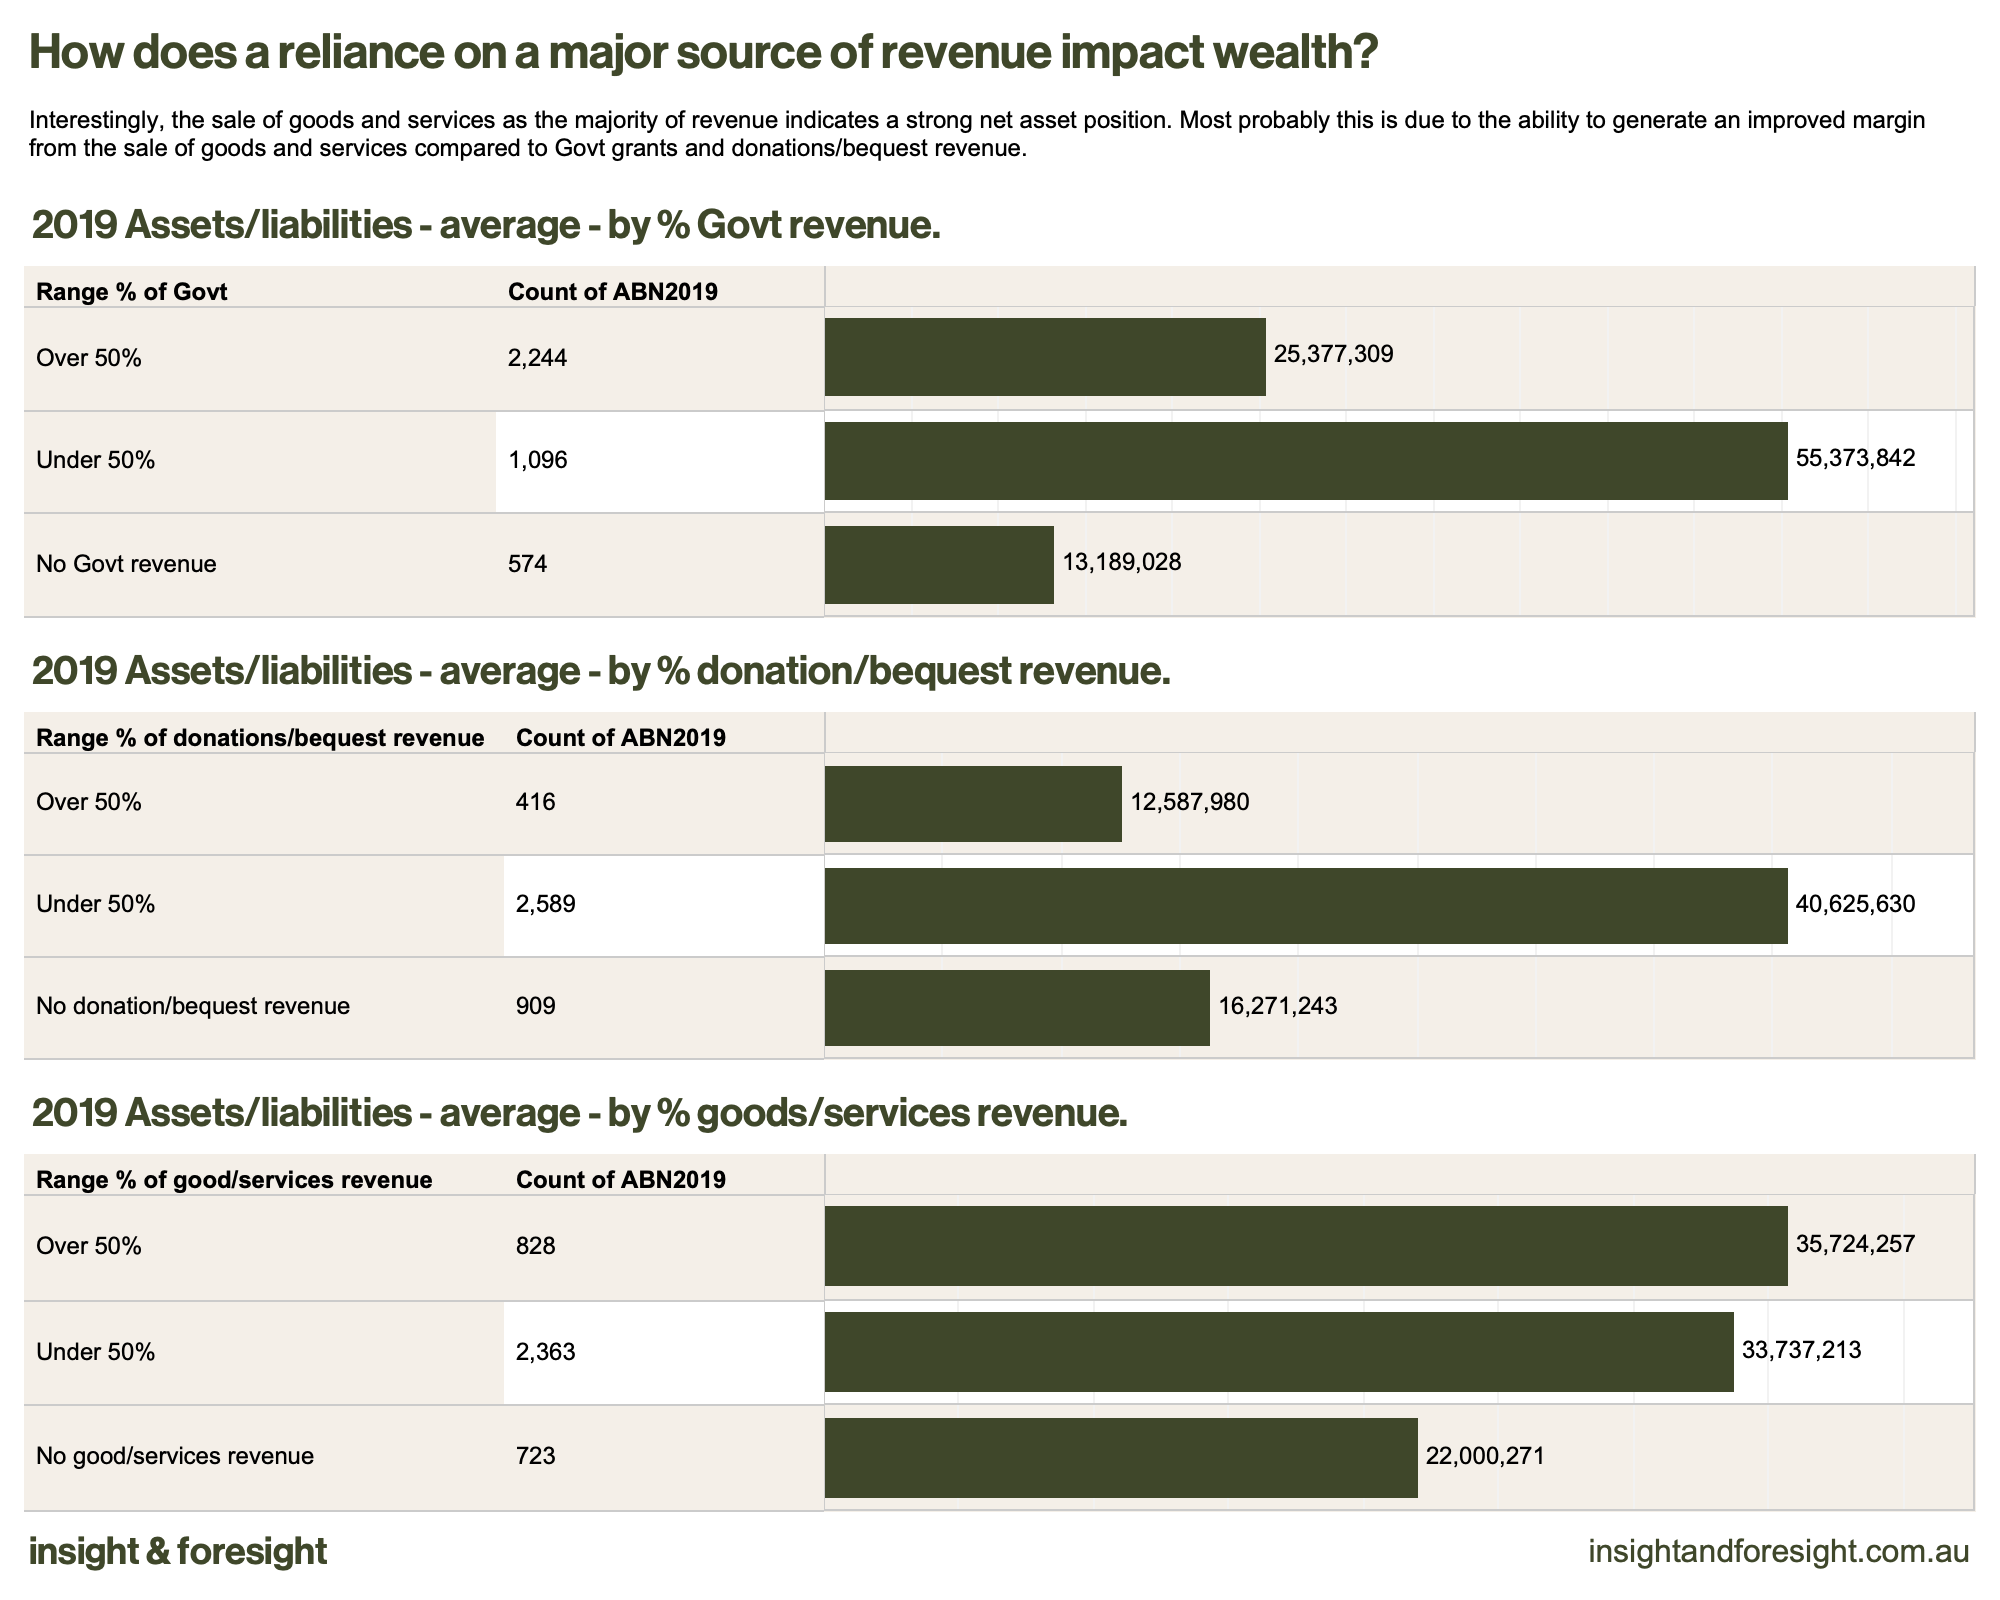
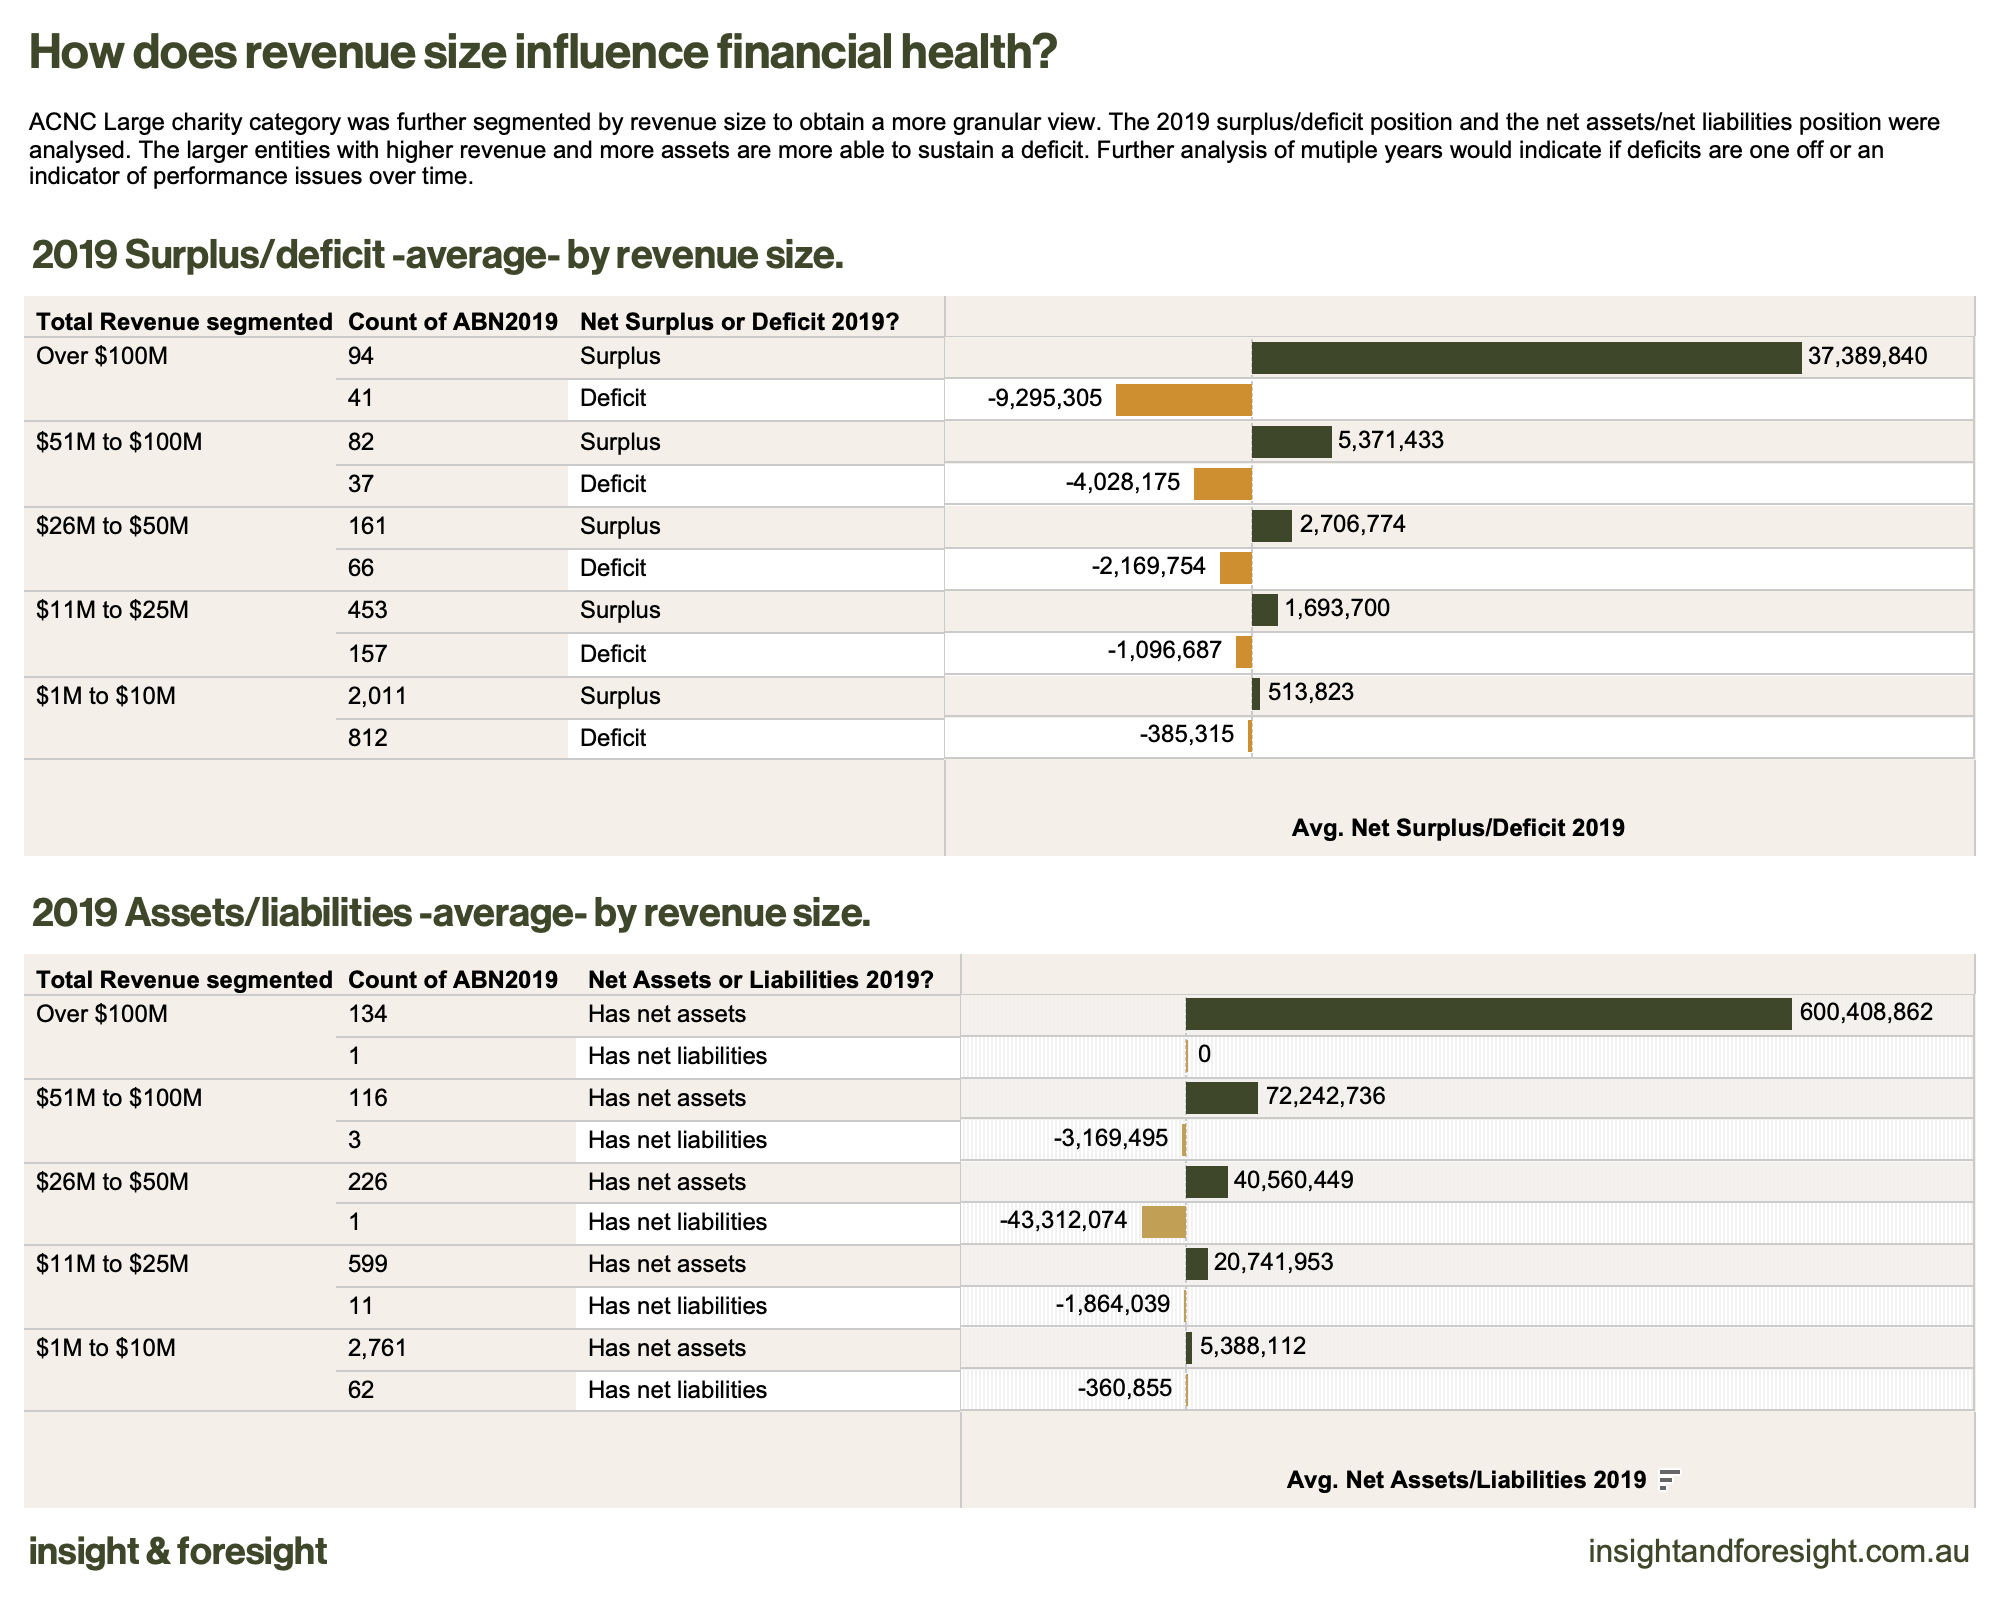
The majority of Australian charities sourcing revenue from the public in 2019 are financially healthy.
Balance sheet size, as measured by current and non-current assets and liabilities, seems proportionate to the revenue size of the sector.
Entities with land and property assets have larger balance sheets then those without. Land and property value increases, in particular in metropolitan areas, have contributed to balance sheet health.
Growth in revenue does not seem to have been disproportionately used to support balance sheet growth.
The addition of cashflow data to the ACNC dataset would allow for a more comprehensive assessment of financial health.
In summary Australian charities are nether rich nor poor. The data would indicate that the majority are financially healthy. More detailed analysis over time with comparisons to financial health benchmarks and best practice would provide a clearer picture.
Dataset selection and cleaning.
The ACNC dataset is publicly available and contains the financial reporting data from over 49,000 charities. The dataset is also reported annually, and datasets exist from 2013. The dataset is comprehensive and very well presented making it easy to access and analyse.
Minimal cleaning was required other then to format worksheets and cells. A small amount of data linking was conducted outside Tableau to enable easier working. In Tableau each dataset was linked via the Australian Business Number (ABN) field a common field to all datasets and one that is standard and consistent over years and datasets.
The privacy and ethics of using the data was already addressed by the Australian Government. Reporting charities are given high transparency as to how the data will be used. Charities can request data to be revoked and kept private. Special consideration was given in the Tableau workbook to the inclusion of mapping worksheets that show geographic location of entities. It was decided that as the data is already public that mapping did not provide any additional transparency or identification of reporting entities.
Additional calculations were added to the dataset in Tableau to further enhance the analysis and story
Legal and ethical considerations.
The data was downloaded on 22/02/22 from https://data.gov.au/search?q=acnc. This is a publicly accessible dataset managed by the Australian Government under the responsibility of The Australian Charities and Not-for-profits Commission (ACNC). A full data information statement and explanatory notes for each dataset can be found at https://data.gov.au/search?q=acnc. The datasets are licensed under Creative Commons Attribution 3.0/2.5 Australia.
The ACNC notes that charities provide permission for the data to be publicly available and can revoke that permission at any stage. Hence, data access permissions may change. Analysis was not performed on any single entity therefore unique charites are not identifiable from the aggregated analysis.